
In the past, I did not pay much attention to bonds or fixed income classes. This was due to various factors, ranging from my perception of poor returns to my debt-averse upbringing.
As a child, my parents instilled in me a concept of financial responsibility and the simple notion if you can’t afford something, then you shouldn’t buy it. Their ideology could be summarized by Proverbs 22:7: “… the borrower is the slave of the lender.”
As time passed, however, I realized that my parents and the Bible were warning me of the dangers of being in debt, not of using it.
In fact, I later found a more congenial view of the activities of the lender which is depicted in the book of Matthew verse 22 of chapter 27, “You should have put my money on deposit with the bankers, so that when I returned I would have received it back with interest.” So, lending can be not only profitable but also morally justified.
This moral justification, however, does not guard against my assumption of less than stellar returns. I used to tell myself, why would anyone want to be a lender, when we can be an owner? In theory, being an owner is more profitable but the basis for this revolves around efficient market theory.
But wait…
If I don’t agree with efficient market theory in the areas in which I already have the expertise, why should I rely on it here?
I shouldn’t, and neither should you. Particularly in 2018 and for several reasons, including:
- The fact that the bond market is worth over $247 trillion dollars. It is an opportunity set that is simply too large to ignore.
- Owning the S&P 500 has increased to more than twice the former price (according to a myriad of metrics: P/E 10, P/B, Price/Sales)
- Clients and readers like you (and perhaps myself, too) have a need for safer, less volatile investments.
- Technology is disrupting and creating new spaces within the asset class.
This leads me to wonder. Perhaps decent returns can exist within fixed income…
The Research Into Several Types of Fixed Income Classes
And so I loaded up our HIT Investments fire-box and got the research train rolling. Aggregating data from 14 fixed income classes, ranging from international high yield bonds to domestic short-term treasuries, was like shoveling coal: difficult, but necessary.
Another benefit of doing the work was finding opportunities that would have been overlooked. I noticed fin-tech firms had created a new Peer to Peer (P2P) space. Peer-to-Peer marketplaces connected lenders to borrowers without the need for traditional brick and mortar banks.
This concept had been developing for the past 10 years and that, up until this point, it had grown to a market of more than $54 Billion in the United States alone. Overseas, the trend is even more obvious, with China’s P2P market transacting over $100B! The removal of a former industry standard, the middleman, and the transaction of more than $150 billion is reason enough to consider the ramifications of P2P.
P2P platforms made real estate, personal, and business loans available for purchase, and personal and real estate loans were included in our research, while business loans did not make the cut (More on why here).
This brought our research to 16 fixed income classifications.
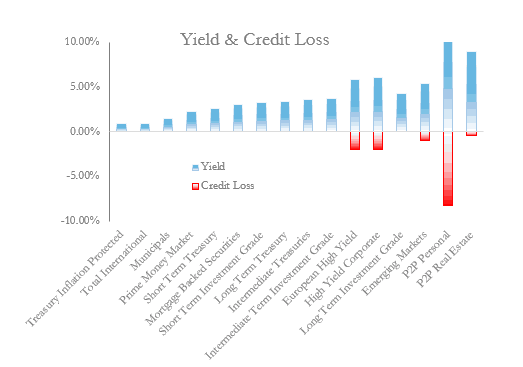
After including P2P and aggregating the data, we ranked each class by their current estimated long-term returns. To do this, the current yield of each class was taken and the associated credit loss of each was then detracted*. The yield data was pulled from Vanguard, T. Rowe Price and multiple P2P platforms.
The estimated credit losses were extrapolated from academic research reports and open sourced data analytics.
Fixed Income Research Results
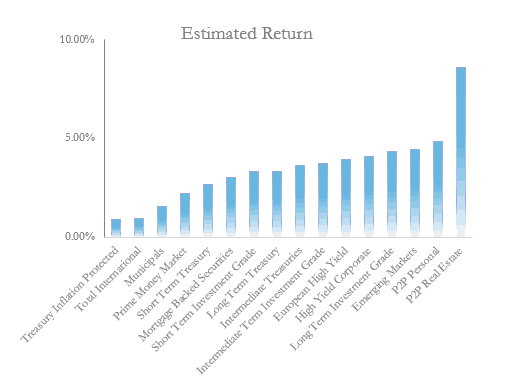
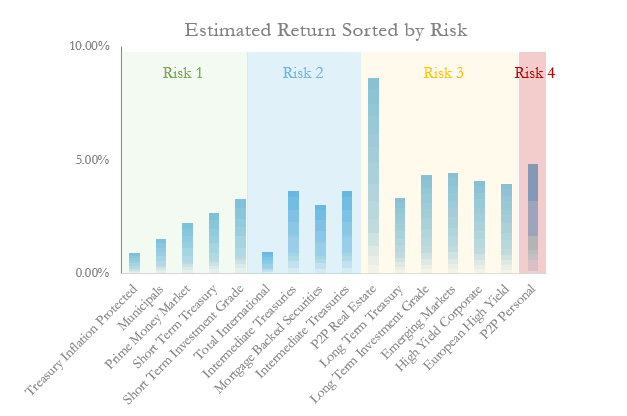
The first chart separates yield and credit loss by fixed income class. The second chart combines yield and credit loss into estimated long-term returns. Finally, the third chart splits the fixed income classes into risk profiles. These all assume that your investment is spread over multiple investments within the class and held until maturity.
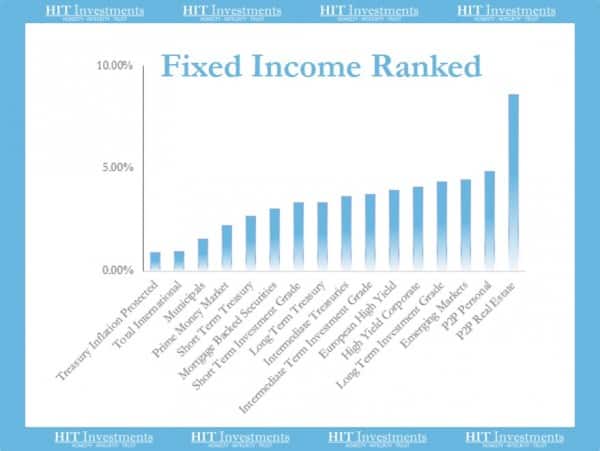
Best Fixed Income Investments
Ranked by estimated returns with #1 being the highest returns and 16 being the lowest.
- P2P real estate
- P2P personal
- Emerging markets
- Long-term investment grade
- High yield corporate
- European high yield
- Intermediate term investment grade
- Intermediate treasuries
- Long-term treasury
- Short term investment grade
- Mortgage-backed securities
- Short term treasury
- Prime money market
- Municipals
- Total international
- Treasury inflation-protected
The Conclusion From Our data
The returns ranged from 0.9% to 8.81%/yr, which was a larger spread than expected. Theoretically, according to the efficient market theory, the riskiest assets should have displayed the largest returns and vice versa. But the research showed otherwise.
A few additional insights included:
- The upper-end of fixed income classes compete with equity and stock returns
- P2P investments are returning more than the traditional fixed income classes
- P2P personal loans are 4x riskier than any other fixed income class, but do not command the highest returns
- P2P real estate loans have high yields without the highest associated risk of credit loss
- Total international bonds are not competitive
- P2P real estate loans are returning 3x more than their publicly traded brethren, mortgage backed securities
- Do the research before forming an opinion
Don’t miss out, have the next newsletter delivered straight to your inbox.
Definitions and Resources:
*Credit loss is a loss which occurs when a customer does not pay the money that is owed. An equation for estimating credit loss is: (1-the probability of default)*(the recovery rate).
Hamilton, D.T., P.Varma, S. Ou and R. Cantor, 2004 “Default & Recovery Rates of Corporate Bond Issuers: A Statistical Review of Moody’s Ratings Performance 1970- 2003” Moody’s Investors Service, January.
Vanguard
T.Rowe Price
Statistica
53 Peer to Peer Marketplaces
Leave A Comment