
Benjamin Graham, the forefather of fundamental value investing once taught Warren Buffett, “Price is what you pay. Value is what you get”.
Since Benjamin Graham wrote Security Analysis in the 1930’s, more academics, quantitative analysts, and Warren Buffett, have made strong cases that value investing outperforms the general market over the long term. In one example, Buffett’s firm Berkshire Hathaway employs value investing, and their track record outperformed the S&P 500 by 1,586,929% over the last 51 years. (1964-2015 Berkshire Hathaway gained 1,598,284% while the S&P 500 gained 11,355%)
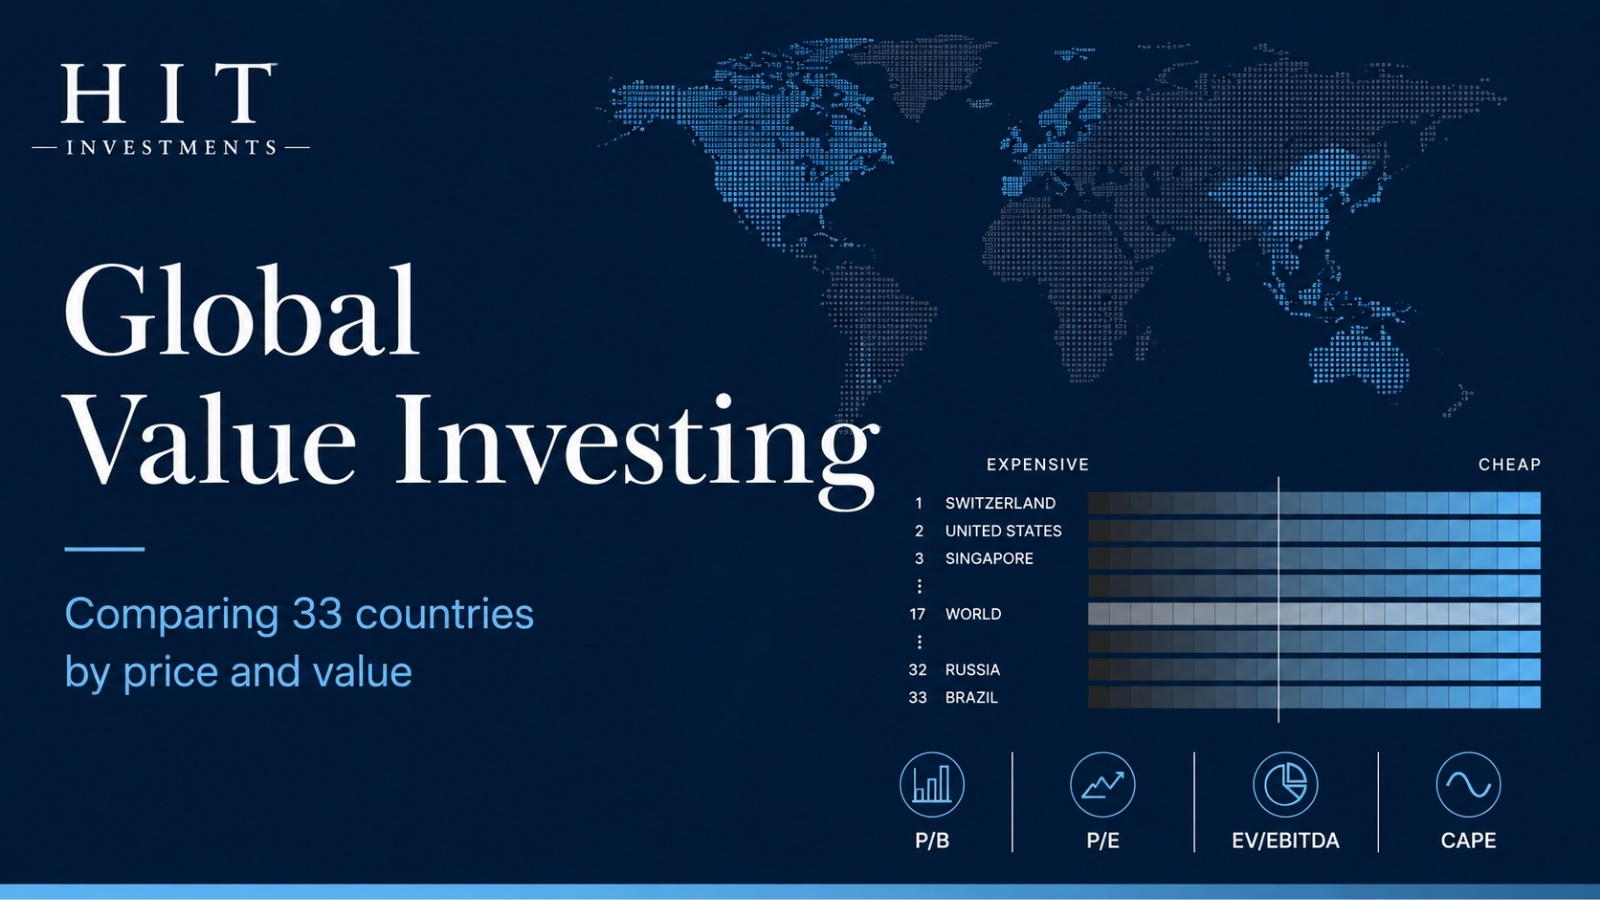
As we like to build upon our predecessor’s learnings, HIT Investments aggregated value data from around the globe. The four financial value metrics we aggregated were: Price to Earnings, Price to Book, Cyclically Adjusted Price to Earnings, and Enterprise Value to Earnings before Interest, Taxes, Depreciation and Amortization.
We broke each value metric down by country, which is displayed in the following charts. The countries are listed from expensive on the left to cheap on the right. The cost for what you receive is on the y-axis, which means the higher the number, the more expensive the country.
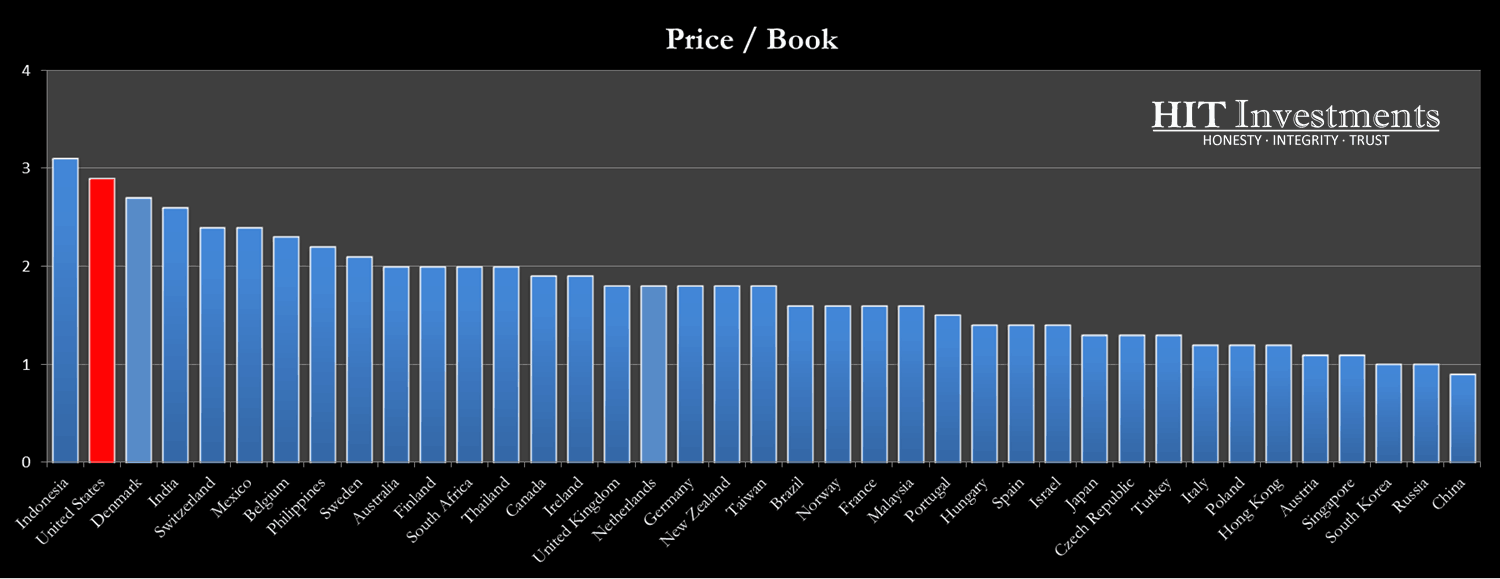
Our first value metric, Price to Book (P/B), is the price the investor is willing to pay for a company’s equity relative to its net asset value. When calculating the P/B on your own, the price of the business is the market capitalization or the share price multiplied by the number of outstanding shares. The book or book value is calculated by taking the total assets of the business and subtracting out the intangibles and liabilities or debts.
Price to Book
The P/B ratio has a couple advantages over the other value metrics I later describe in this article. The first is that the ratio is still useful when a business has negative earnings. The second advantage is that it is less volatile than the value metrics based on earnings. The disadvantage is that we typically want to own a business for the money it makes, not specifically for the assets it owns.
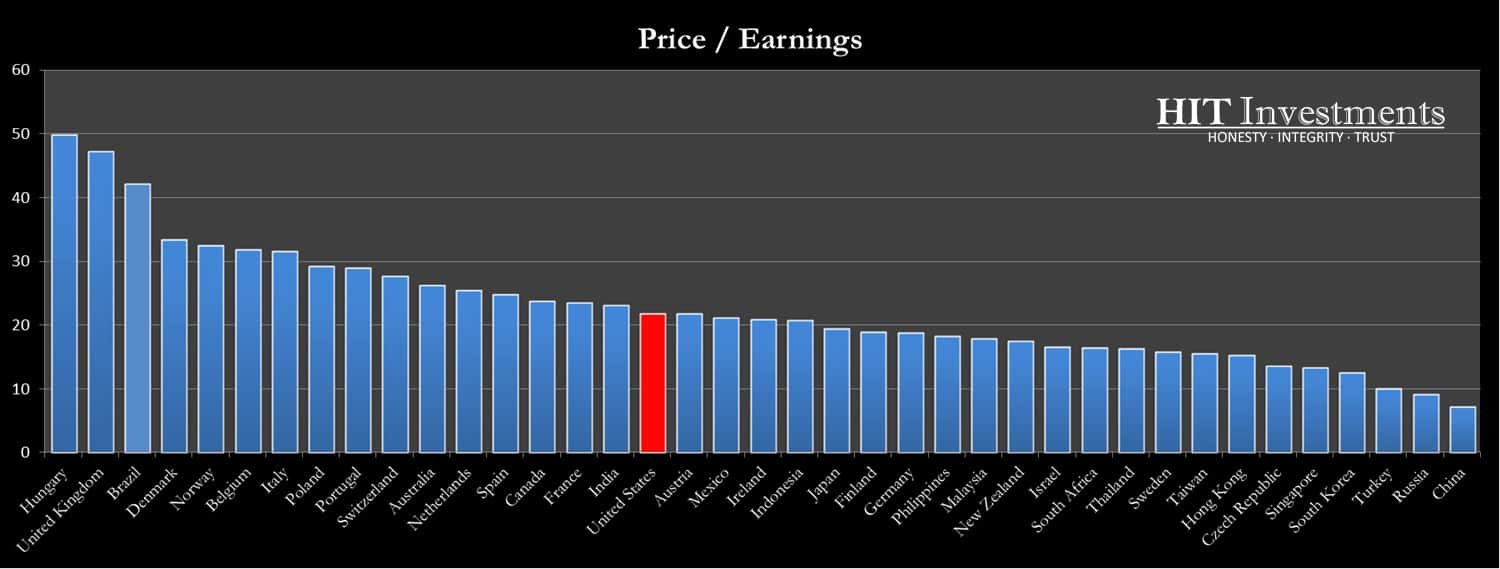
Price to Earnings
The P/E, or Price to Earnings ratio is our next value metric. This is the same price metric as we used with a price to book, but instead of using the assets in the denominator, we use the earnings of a business. The earnings of a business can otherwise be referred to as it’s after-tax net income. The advantage of using P/E is its availability; it is the most referenced and used value metric. Some of the disadvantages include that it is harder to tell how much leverage the business is using, and it has historically been a poorer predictor of future returns than some of the other value metrics in its class.
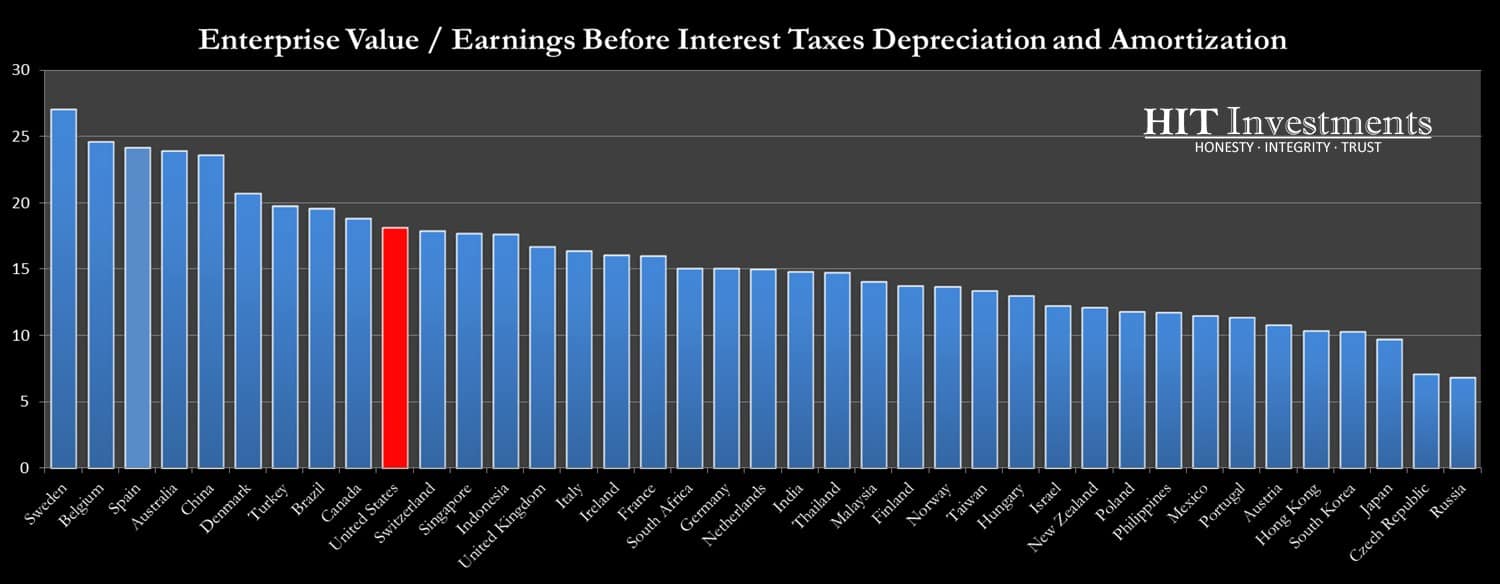
EV/EBITDA
EV/EBITDA is the Enterprise Value over the EBITDA. The EV/EBITDA has an inherent quality metric because it takes into consideration the cash and debt the business has on hand. The enterprise value is calculated by adding the market capitalization, debt, minority interest, and preferred shares, minus total cash and cash equivalents of the business. This is otherwise known as the acquirer’s cost since the purchaser would assume all of these costs if they themselves purchased the business. EBITDA is the earnings of the business before adjusting for interest, taxes, depreciation, and amortization. Since EBITDA removes all of the financial and tax nuances outside of the businesses core operating practices it is also referred to as the operating performance of the business.
The first advantage of using EV/EBITDA is its ability to compare businesses on their operating performance through the elimination of potential financial noise. The second advantage is how it inherently incorporates a quality metric by including the debt and cash on hand. A couple disadvantages of this metric are that it can be volatile, and it is not as well-known as the previous metrics mentioned. If you want to use this metric in your own analysis’s you may need to browse through financials and make the calculations yourself.
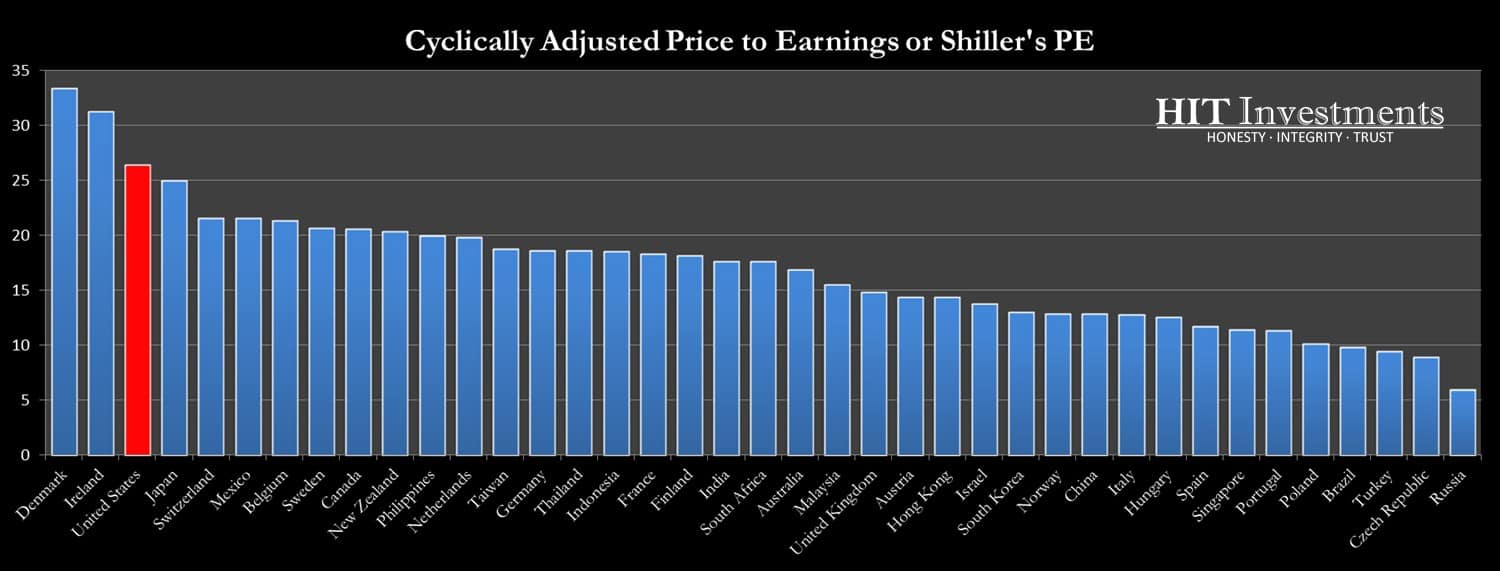
CAPE
CAPE, otherwise known as Shiller’s PE, is the Cyclically Adjusted Price to Earnings Ratio. The price to earnings ratio is as described above, but instead of using the annual earnings, it uses the 10 year moving average adjusted for inflation. The CAPE’s advantage is that it is more stable than the yearly averages, and usually accounts for a full business cycle. When looking for broad trends across many companies and countries, it can make sense to use cyclically adjusted earnings rather than annual earnings.
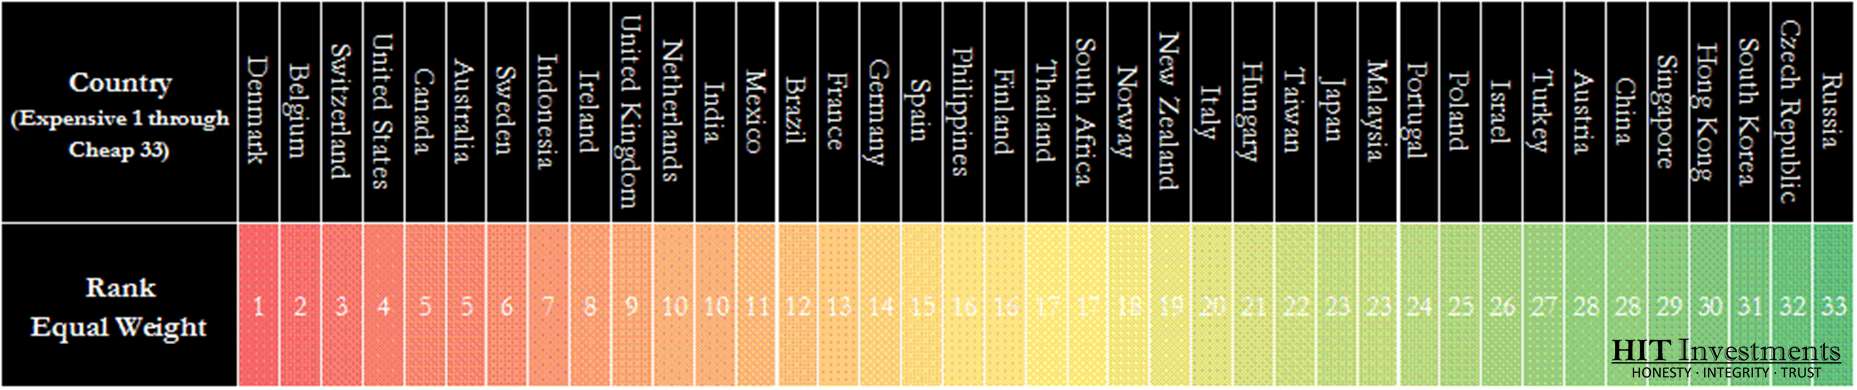
Global Rankings
Since each value metric has its advantages and disadvantages we equally weighted them and ranked the countries from the most expensive in red to the cheapest in green. Where do most of your investments rank? If you are home biased, which most of us are, is your home currently cheap?
References, Data Sources & Disclosures:
Data was derived from:
Berkshire 2016 Annual Report, Berkshire Hathaway Data – The S&P 500 numbers are pre-tax whereas the Berkshire numbers are after-tax. If a corporation such as Berkshire were simply to have owned the S&P 500 and accrued the appropriate taxes, its results would have lagged the S&P 500 in years when that index showed a positive return, but would have exceeded the S&P 500 in years when the index showed a negative return. Over the years, the tax costs would have caused the aggregate lag to be substantial.
The value metrics are from the latest available data between December 30th, 2016 and January 5th, 2017.
Star Capital and Aswath Damodaran aggregated much of the data from:
Star Capital, Thomson Reuters, Bloomberg, Morningstar, Capital IQ, Compustat
Other References:
Warren Buffett’s 2007 Chairman’s Letter
Quantitative Value by Wesley Gray
On the Performance of Cyclically Adjusted Valuation Measures by Jack Bogle & Wesley Gray
This info is priceless.
Great looking website. Assume you did a bunch of your very
own html coding.
UPDATE please!
Max, check out this great valuation site by Star Capital. They rate countries by multiple factors too and it is updated quarterly. https://www.starcapital.de/en/research/stock-market-valuation/