
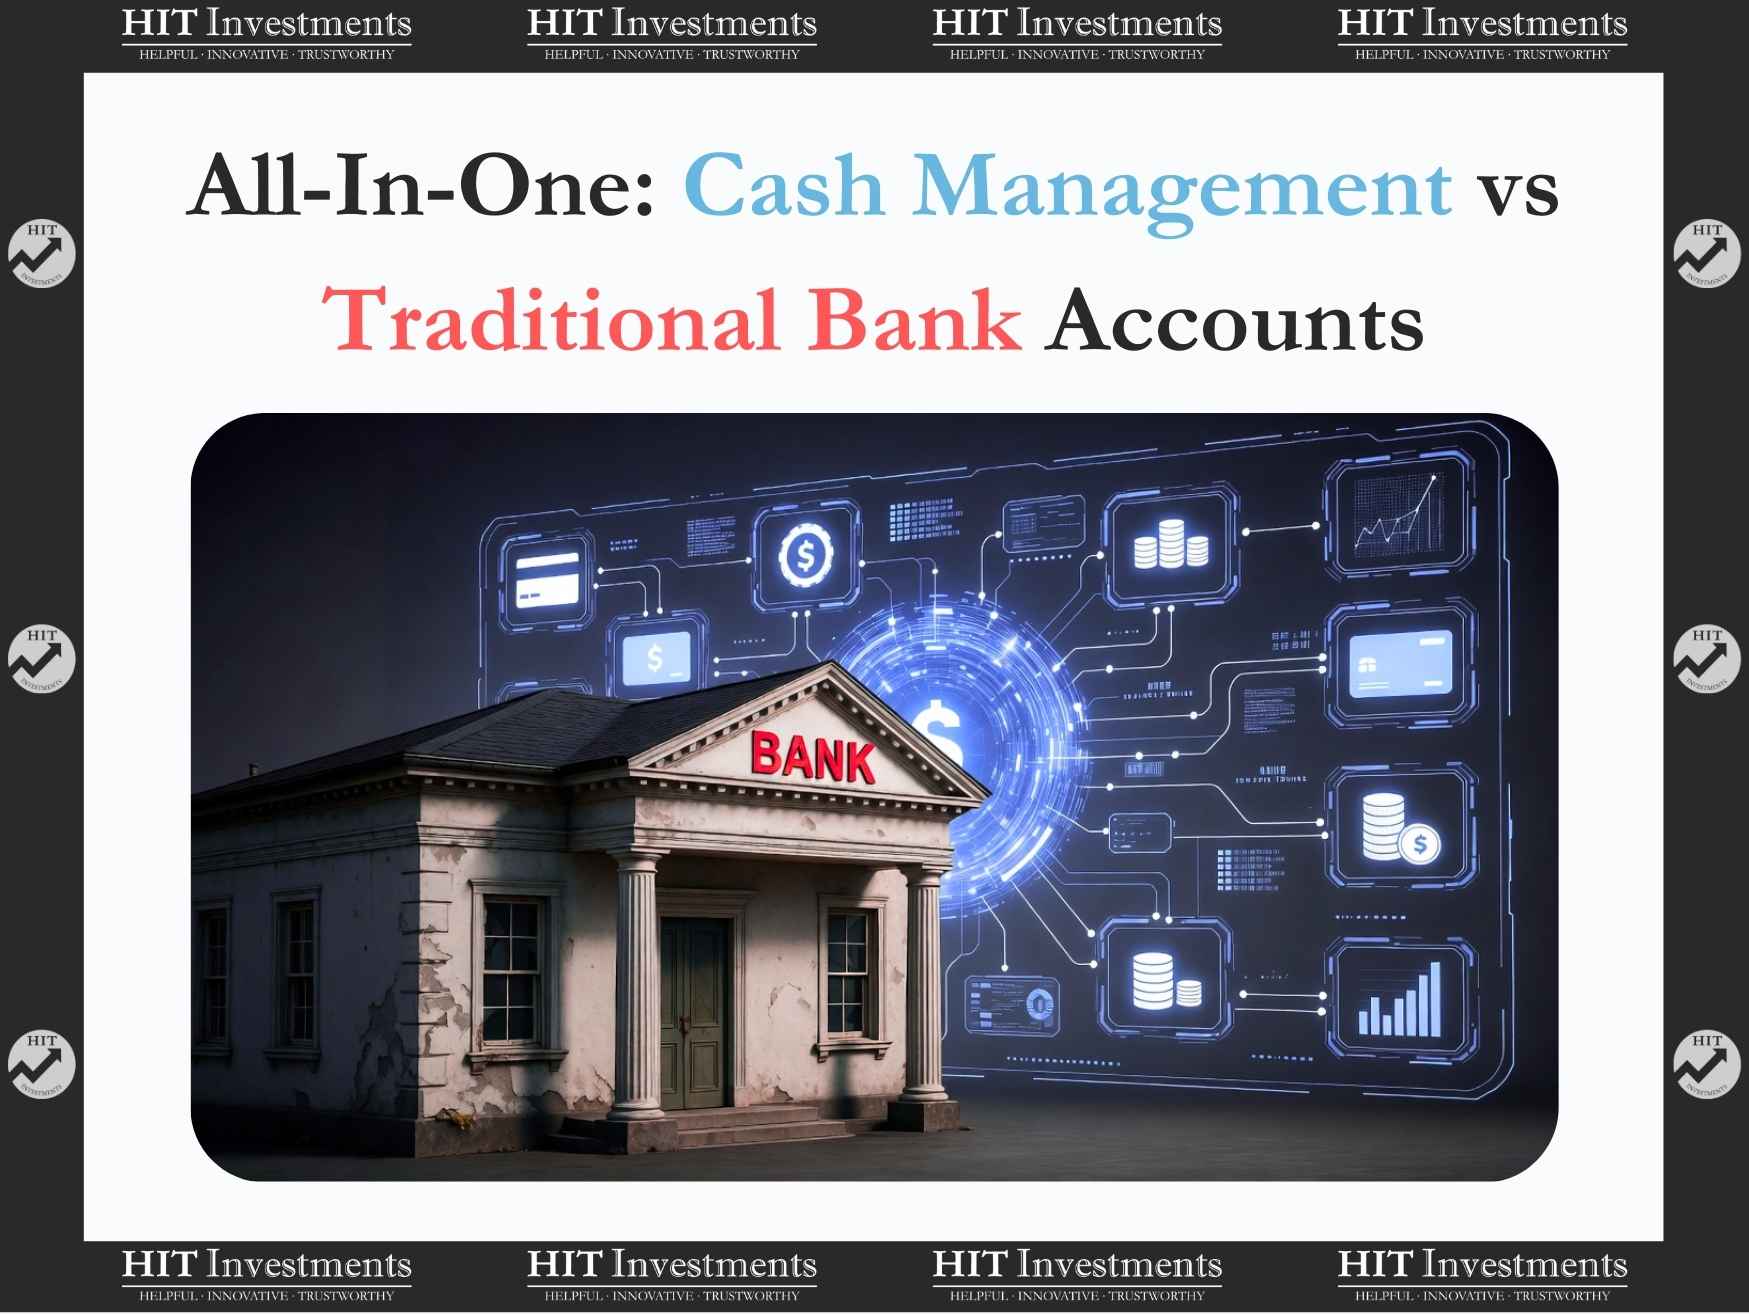
The Traditional Banking Model is Broken
Traditional banks operate on a business model that worked well in the 1980s but struggles in today’s low-margin, hyper-competitive, high-tech environment.
Fee structures that punish stackers
Most traditional banks generate significant revenue through fees. Consider these common charges I find in my friends accounts across major banks:
- Monthly maintenance fees: $12-25 per month ($144-300 annually)
- Minimum balance requirements: $1,500-25,000 to avoid fees
- ATM fees: $2.50-5.00 per transaction outside network
- Wire transfer fees: $15-30 domestic, $35-50 international
- Overdraft fees: $35 per occurrence
A friend maintaining checking and savings accounts at a major bank might pay $200-400 annually in fees alone, before considering opportunity costs from low interest rates.
These fee structures particularly penalize young stackers who are close to the minimums. A professional with $30,000 in savings might face monthly fees while earning negligible interest, creating a double penalty for responsible financial behavior.
Interest rates that lag the market
Traditional banks consistently offer savings rates well below market alternatives. As of today 3/3/2026, major banks typically offer:
- Savings accounts: 0.01-0.45% APY
- Money market accounts: 0.05-0.60% APY
- CDs (1-year): 0.30-1.50% APY
Compare this to the current federal funds rate of 3.64% and money market funds yielding 2.9-3.2%. The spread represents an opportunity for stackers.
On a $100,000 balance, this difference matters significantly:
- Traditional bank savings (0.45% APY): $450 annual interest
- Money market fund (2.9% APY): $2,900 annual interest
- Opportunity cost: $2,450 per year
Over a decade, this $2,450 annual difference compounds to approximately $28,000 in additional earnings, assuming the spread remains consistent and earnings are reinvested.
Fidelity’s Integrated Approach
Fidelity Cash Management Account attempts to solve these problems by combining checking, savings, and investment services into a single account. Rather than operating as a traditional bank, Fidelity partners with banks to provide FDIC insurance while offering the SPAXX ETF as the primary cash vehicle for higher yields.
All-in-one account structure
The integration works through several key features:
Unified dashboard: All financial activity checking, savings, investment, HSA, and retirement accounts appears in one interface. This visibility helps with asset allocation decisions and cash flow management.
Automatic sweep functionality: Cash automatically moves into a higher-yielding SPAXX ETF or a FDIC insured account, optimizing returns without manual intervention.
Single account management: Since checking, savings, and investing can operate within one account, there’s no need to transfer money between the three or other institutions for various financial activities.
Single tax reporting: All activity generates consolidated 1099 forms, simplifying tax preparation and reducing paperwork complexity.
Feature comparison matrix
| Feature | Traditional Bank | Fidelity Cash Management |
|---|---|---|
| Monthly fees | $12-25 | $0 |
| Minimum balance | $1,500-25,000 | $0 |
| Interest rate | 0.01-0.45% | 2.9-3.2% (SPAXX ETF) |
| ATM network | Bank-specific | 60,000+ ATMs worldwide |
| ATM fee reimbursement | Limited/none | Unlimited domestic |
| Check writing | Yes | Yes |
| Bill pay | Yes | Yes |
| Mobile deposit | Yes | Yes |
| Wire transfers | $15-50 | $0 domestic, $50 international |
| Investment integration | None | Full platform access |
| FDIC insurance | Up to $250K | Up to $1.25M (multiple banks) |
| SIPC insurance | N/A | Up to $500K for securities |
Running the Numbers: Cost Analysis
Understanding the true cost difference requires examining both explicit fees and opportunity costs across different balance levels.
Annual fee comparison across account types
Traditional bank scenario (major national bank):
- Checking account: $15/month = $180/year
- Savings account: $5/month = $60/year
- Wire transfers: 4 per year × $25 = $100/year
- ATM fees: 12 per year × $3 = $36/year
- Total annual fees: $376
Fidelity Cash Management scenario:
- Monthly maintenance: $0
- Wire transfers: 4 = $0
- ATM fees: $0 (reimbursed)
- Total annual fees: $0
Annual fee savings: $376
Interest earnings on $50K, $100K, $200K balances
The interest rate differential creates substantial opportunity costs that compound over time.
$50,000 balance comparison:
- Traditional bank (0.45% APY): $225 annual interest
- Fidelity SPAXX ETF (2.9% APY): $1,450 annual interest
- Additional earnings: $1,225/year
$100,000 balance comparison:
- Traditional bank (0.45% APY): $450 annual interest
- Fidelity SPAXX ETF (2.9% APY): $2,900 annual interest
- Additional earnings: $2,450/year
$200,000 balance comparison:
- Traditional bank (0.45% APY): $900 annual interest
- Fidelity SPAXX ETF (2.9% APY): $5,800 annual interest
- Additional earnings: $4,900/year
Combined annual benefit (fees + interest):
- $50K balance: $1,225 + $376 = $1,601
- $100K balance: $2,450 + $376 = $2,826
- $200K balance: $4,900 + $376 = $5,276
These differences compound significantly over time. A saver with $100K earning an additional $2,776 annually would accumulate approximately $31,678 more over 10 years, assuming earnings are reinvested at the same 2.9% rate.
Security and Convenience Trade-offs
Moving from traditional banking to an integrated investment platform involves important trade-offs around security, insurance, and operational complexity.
SIPC vs FDIC protection explained
Traditional bank deposits receive FDIC insurance up to $250,000 per depositor, per bank. This insurance covers bank failures but not investment losses.
Fidelity Cash Management provides FDIC insurance through multiple partner banks, extending coverage up to $1.25 million per account holder. Cash balances are automatically allocated across these banks to maximize insurance coverage.
However, SPAXX ETF investments receive SIPC protection rather than FDIC insurance. SIPC covers up to $500,000 per customer if the brokerage fails, but does not protect against investment losses. SPAXX and MMA’s are considered low risk as most underlying holdings are in government backed securities.
Risk assessment:
- FDIC insurance: Absolute protection against bank failure up to limits
- SIPC protection: Covers brokerage failure but not investment performance
- SPAXX ETF risk: Extremely low but not zero probability of principal loss
Single sign-on benefits and risks
Consolidating financial services creates both conveniences and vulnerabilities.
Benefits:
- Reduced password management complexity
- Unified financial dashboard for better decision-making
- Streamlined account monitoring and maintenance
- Simplified tax reporting and record-keeping
Risks:
- Single point of failure for account access
- Increased impact if primary account becomes compromised
- Potential service disruptions affecting all financial services
- Reduced diversification of financial service providers
Mitigation strategies:
- Enable two-factor authentication on all accounts
- Maintain backup access methods (phone, email alternatives)
- Regular monitoring of account activity
- Keep an alternative account at a separate institution
Implementation Strategy for Stackers
Transitioning from traditional banking to integrated cash management requires careful planning to avoid disruptions while maximizing benefits.
Gradual transition timeline
Month 1: Setup and testing
- Open Fidelity Cash Management account
- Set up direct deposit
- Test bill pay functionality
- Verify ATM access and mobile app functionality
- Transfer 25-50% of emergency fund
Month 2: Full consolidation
- Redirect full direct deposit to Fidelity
- Transfer automatic bill payments for major expenses
- Move remaining emergency fund balance
- Close primary traditional checking account (keep one small traditional account)
Which accounts to keep vs consolidate
Accounts to consolidate:
- Primary checking and savings accounts
- Money market accounts at traditional banks
- CDs earning below 2% APY
- Multiple checking accounts with monthly fees
Accounts to keep separate:
- One small traditional bank account for accessing small bills, Zelle payments, cashier’s checks, notarization, or cash deposits
- Business banking relationships
- Local bank accounts for specific geographic needs (Alaska dividend)
- Specialty accounts with unique benefits (global trading access)
Special considerations:
- Evaluate existing banking relationships for any unique services you might need
What This Means for Stackers
The math strongly favors integrated cash management, adding roughly $1,600–$5,300 per year depending on balance levels, and those gains compound over time. The more powerful edge is structural: visibility, streamlined finances, and less friction in managing your finances.
In our Stacker’s Financial Wellness Program, we treat cash management as a core tool, strengthening our pillars of earning more and spending less.
Leave A Comment