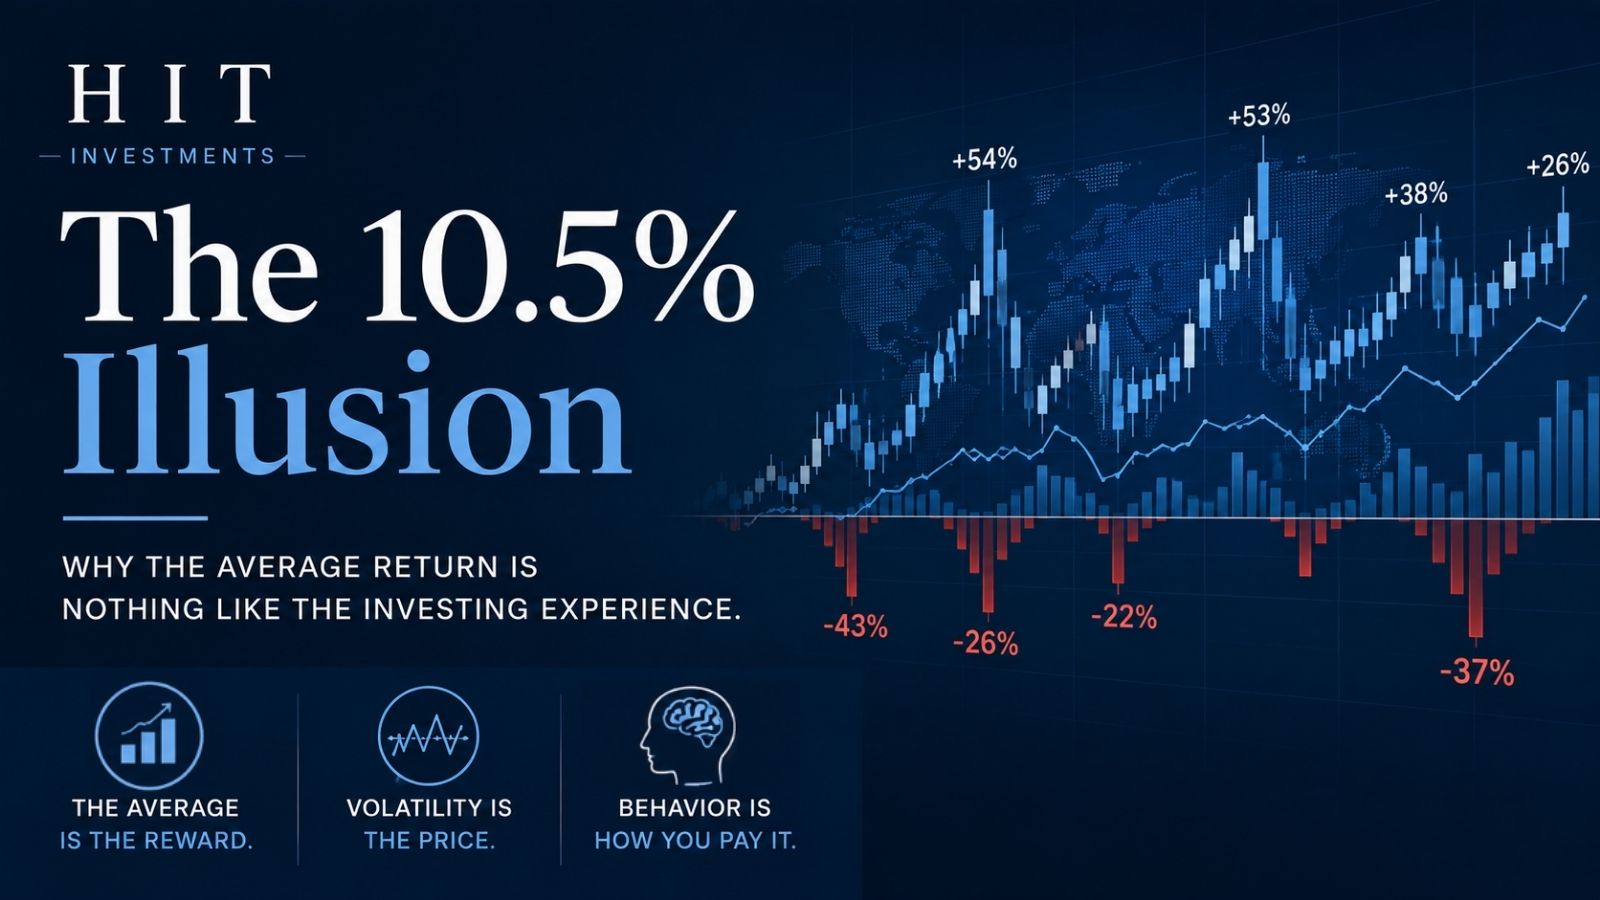
Why the average return is nothing like the investing experience.
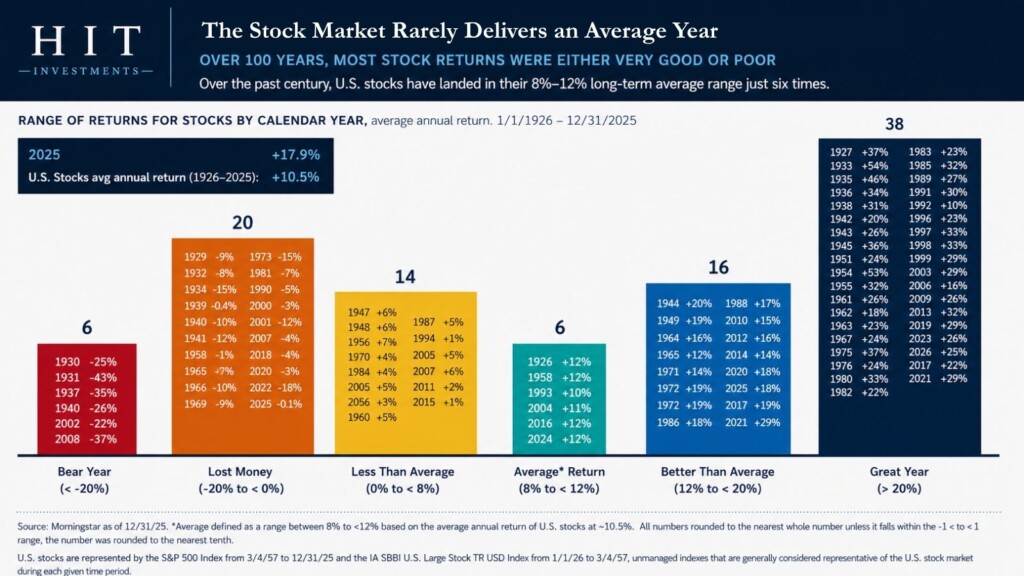
The stock market has produced a historical average annual return of 10.5% over the past century.
Unfortunately, that is not what investing felt like.
The Average Is Misleading
In only 6 of those 100 calendar years did returns actually land in the 8–12% “average” range.
94 out of 100 years were something other than average. 26 lost money. 6 lost more than 20%.
The 10.5% wasn’t earned in equal chunks. It was earned by investors who stayed invested through years like 1931 (–43%), 1974 (–26%), 2002 (–22%), and 2008 (–37%), and who remained invested long enough to experience years like 1933 (+54%), 1954 (+53%), 1995 (+38%), and 2023 (+26%).
The market rarely delivers an average year.
Volatility Is the Price
The average is the reward. Volatility is the price. Behavior is how you pay it.
How We Pay the Price
Here is the part that’s hard for us to grasp: the fee isn’t necessarily charged in dollars. It’s charged in our behavior.
And our wiring works against us in five specific ways:
- Loss aversion. Losing $10,000 hurts roughly twice as much as making $10,000 feels good. A 50/50 portfolio doesn’t feel emotionally neutral, it feels like we’re losing.
Stacker Tip: Write down your reasons for selling before you need to sell. Your calm self is a better advisor than your scared self.
- Recency bias. Whatever just happened feels like what happens next. After a red year, another red year can feel inevitable. It usually isn’t. 74 of the last 100 years were positive.
Stacker Tip: Zoom out to the 100-year picture before you act on the 100-day one.
- Myopic loss aversion. The more often we check, the more losses we see, and the more risk we feel.
Stacker Tip: Decide in advance how often you will review your portfolio. Checking more frequently doesn’t give you more control, it gives your emotions more opportunities to intervene.
- Action bias. Doing something feels like control. In volatile markets, “do something” usually means selling after prices have fallen and buying back after they recover. The cost of that instinct compounds.
Stacker Tip: Before making a major change, write down what you believe has changed, what evidence would prove you wrong, and what would make you reverse the decision.
- Anchoring bias. We plan as if we’ll get 10.5% every year, then treat any deviation as evidence something’s broken. The average return becomes an anchor that creates unrealistic expectations.
Someone builds a retirement plan assuming:
10.5%
10.5%
10.5%
10.5%
10.5%
Then lives through 2018 to 2022:
–4%
+31%
+18%
+29%
–18%
……and we think something has gone wrong.
Nothing went wrong. Those five years averaged 11.2%, better than the century-long average, and not one of them came close to 10.5%. This is what a normal market looks like. We make the mistake of treating the average as the expectation rather than the result of a wildly uneven distribution.
Stacker Tip: Plan for the volatility alongside the average. The volatility IS part of the plan.
How Stackers Lower the Price
Don’t wait for volatility to decide how you’ll behave.
- Write your sell rules.
What would actually cause you to sell an investment?
- Establish your review schedule.
How often will you look at your portfolio?
- Stress-test your plan.
What would you do if your portfolio fell 20%, 30%, or 40%?
- Define your rebalancing rules.
When will you buy, sell, or rebalance, and what triggers the decision?
Awareness doesn’t eliminate these biases. Nothing does.
But naming them in the moment creates a pause between a market event and our reaction:
“That’s recency talking.”
“That’s loss aversion.”
“That’s my desire to do something.”
Sometimes that pause is the difference between a rational decision and an emotional one.
The market doesn’t pay us the average. It pays us for enduring the distribution.
Stack knowledge. Stack capital. Stack time.
Volatility is easier to endure alongside people who understand what they’re paying for. The Stackers Club is where serious savers, corporate professionals, and business owners build that discipline together.
Join the Stackers Club →
Source: Morningstar, as of 12/31/25. U.S. stocks represented by the S&P 500 Index (3/4/57–12/31/25) and IA SBBI U.S. Lg Stock Tr USD Index (1/1/26–3/4/57). Returns rounded to the nearest whole percent. Past performance is not a guarantee of future results. You cannot invest directly in an index. This is educational content, not investment advice.